
Valuable data can put your business on the right track to grant your growth in a way you deserve, but that isn’t going to happen without analytics. Marketing analytics is about studying related metrics data to discover trends or find patterns in your data, learn about them and recognize opportunities for improvement.
In fact, by tracking the reports of your analytics you can increase actionable insights for various types of marketing campaigns and optimize your future marketing efforts. This way you can prepare the right answers to your analytics questions that are essential for your eCommerce business. In this article, we will mostly speak about Growmatik analytics and will cover the following topics:
- What is the importance of marketing analytics?
- What is Growmatik analytics?
- What metrics can you track with Growmatik?
- How to change the date range in Growmatik analytics
- How to get a detailed report of any automation rule
- Working with Growmatik charts
- Best practices for using analytics with your marketing automation
- Wrap it up
What is the importance of marketing analytics?
Simply put, marketing analytics helps to turn your raw data into information. That’s when you come up with an idea to take actionable moves that will make your marketing strategy even better than before. It allows you to easily measure the performance of marketing automation. Also, it provides you the chance to compare your marketing data on a monthly basis, so that you can evaluate it and stay goal oriented.
Even if you recognize the importance of marketing analytics, you need to always make sure that the data you rely on is completely accurate and valid. Bad data could lead to a misinterpretation of the analytics, which would be misleading for the entire marketing team and no one likes that to happen.
What is Growmatik analytics?
Analytics is a dependent feature of the Growmatik plugin that generates an in-depth report of your eCommerce website with a wide range of different marketing metrics. Growmatik analytics gives you all the information you need about your web pages engagements, sales statistics, customers and leads and email engagements. Actually, it gives a full report for every campaign you create with Growmatik marketing automation through all your marketing channels including website content, emails and also your popups. Bingo!
As we do care about the importance of marketing analytics, the Growmatik team has paid special attention to providing valid and precise data that eliminates possible concern about the authority of your reports. And that’s what we can promise: reliability!

What metrics can you track with Growmatik?
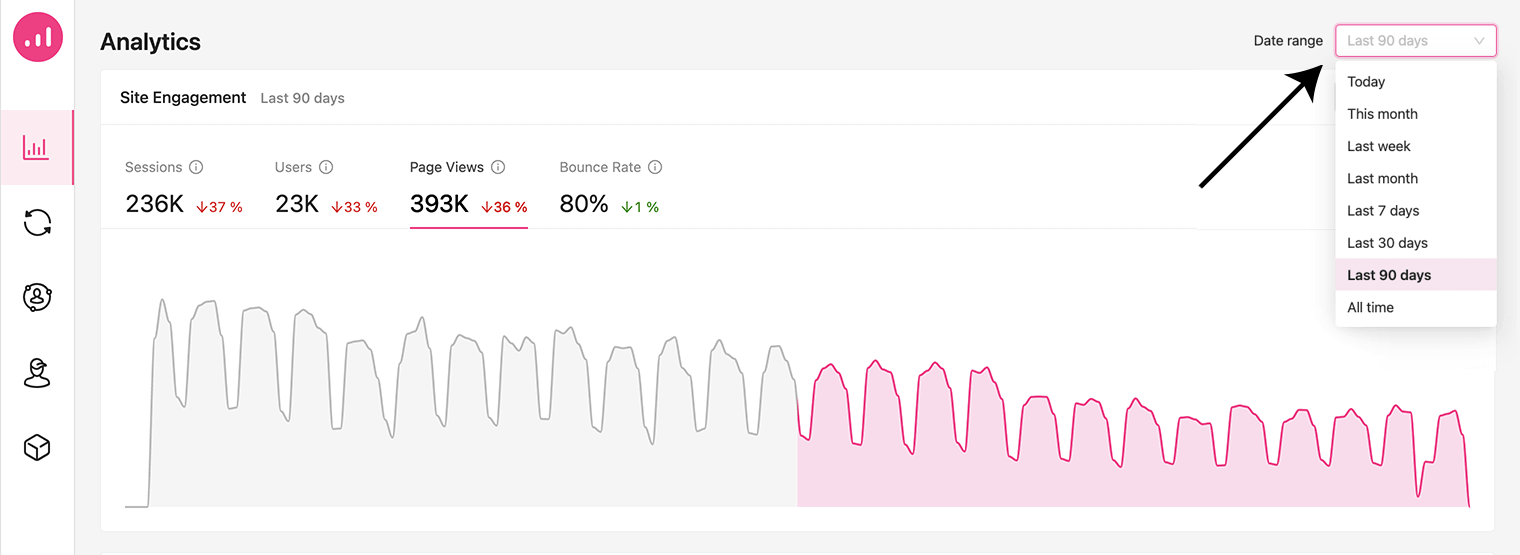
What Growmatik analytics offers you are all comparative, scalable and actionable metrics. To access the analytics page of Growmatik, you need to open your Growmatik dashboard. The first page you’ll see is Growmatik analytics:

It contains 4 main sections: Site engagement, Sales, Customers and Email engagement. Each part offers a series of useful metrics that we are going to talk about in detail here.
Site engagement
At first sight you will just find the four basic metrics listed below. Each one comes with indices of value, growth rate and a data chart within a specific timeframe:

- Sessions: gives you the total number of visits.
- Users: the sum of all unique visits generated by your registered users.
- Page views: shows the number of all page views for your website.
- Bounce rate: indicates the percentage of single-page sessions. Unlike other metrics on the list, the lower this value, the better your site engagement is.
Note: A value represents a quantity, whereas a specific growth rate is a comparative metric that gives you a perspective of positive or negative changes in values in comparison to a past time period.
But if you want to get more information about your website, click on the ‘’more details button” and a modal will open with different tabs:
- Pages: In this tab, you can get insight about metrics like unique page views, page views, bounce rate and Avg. time on page.
- Refers: You can find detailed reports about the segment of traffic that arrives on your website through another source, such as a link on another domain. Here you can track generated sessions, sign ups and also the amount of sales for each referrer.
- UTMs: A set of UTM parameters that drives traffic to your website is listed here. Again you can track the same metrics that are available on the Refers tab. This metric is very useful when you want to keep an eye on your marketing ad campaigns’ UTMs.
- Countries: This shows a list of countries where your audience is located. The same metrics are available as well.
- Search terms: This tab lets you explore 2 different metrics including clicks and impressions on your website URLs from a Google Search results page. You need to integrate with Google Search Console from Site Settings to display data here.

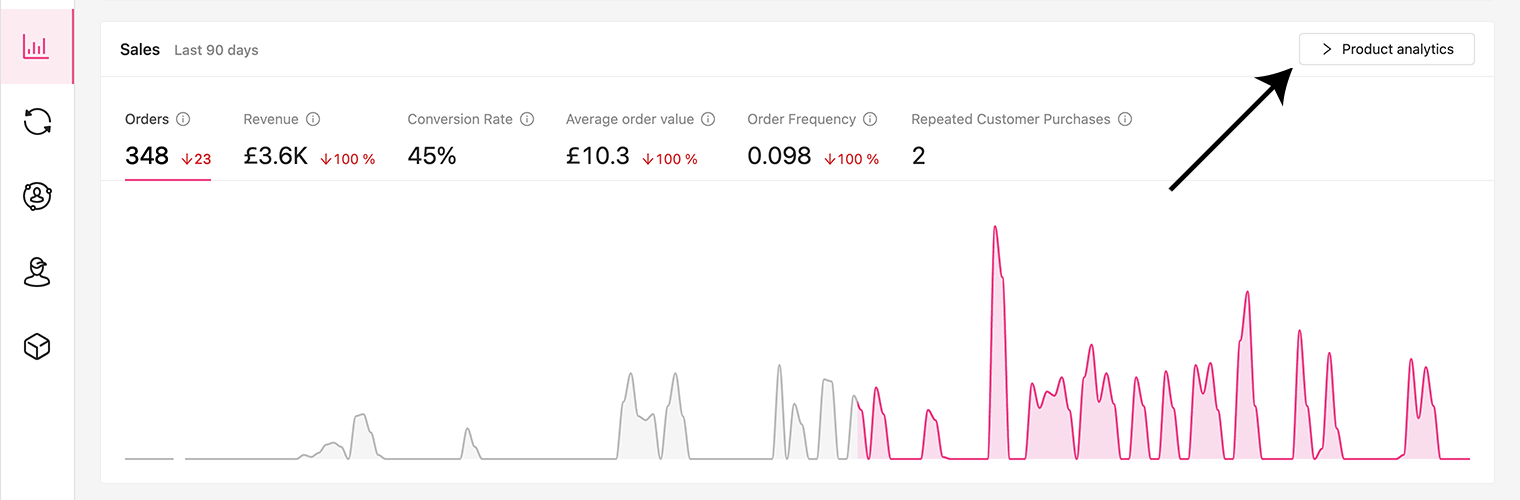
Sales
The Sales section helps eCommerce businesses get insight about their profit margin, top products and other vital shopping metrics in a specific period. These metrics are listed below:

- Orders: The total number of registered orders.
- Revenue: The total amount of generated revenue.
- Conversion rate: This metric divides the total number of orders by all obtained sessions.
- Average order value: How much the average order is, based on total revenue divided by total number of orders..
- Order frequency: How often a customer has purchased from you in a given time frame.
- Repeated customer purchase: How many purchases were made by repeat customers in a given time period.
If you want to track product analytics, you should select that option from the upper right hand button placed in this section. This will open a modal that shows the revenue and quantity sold values for each product you have added to your online store.
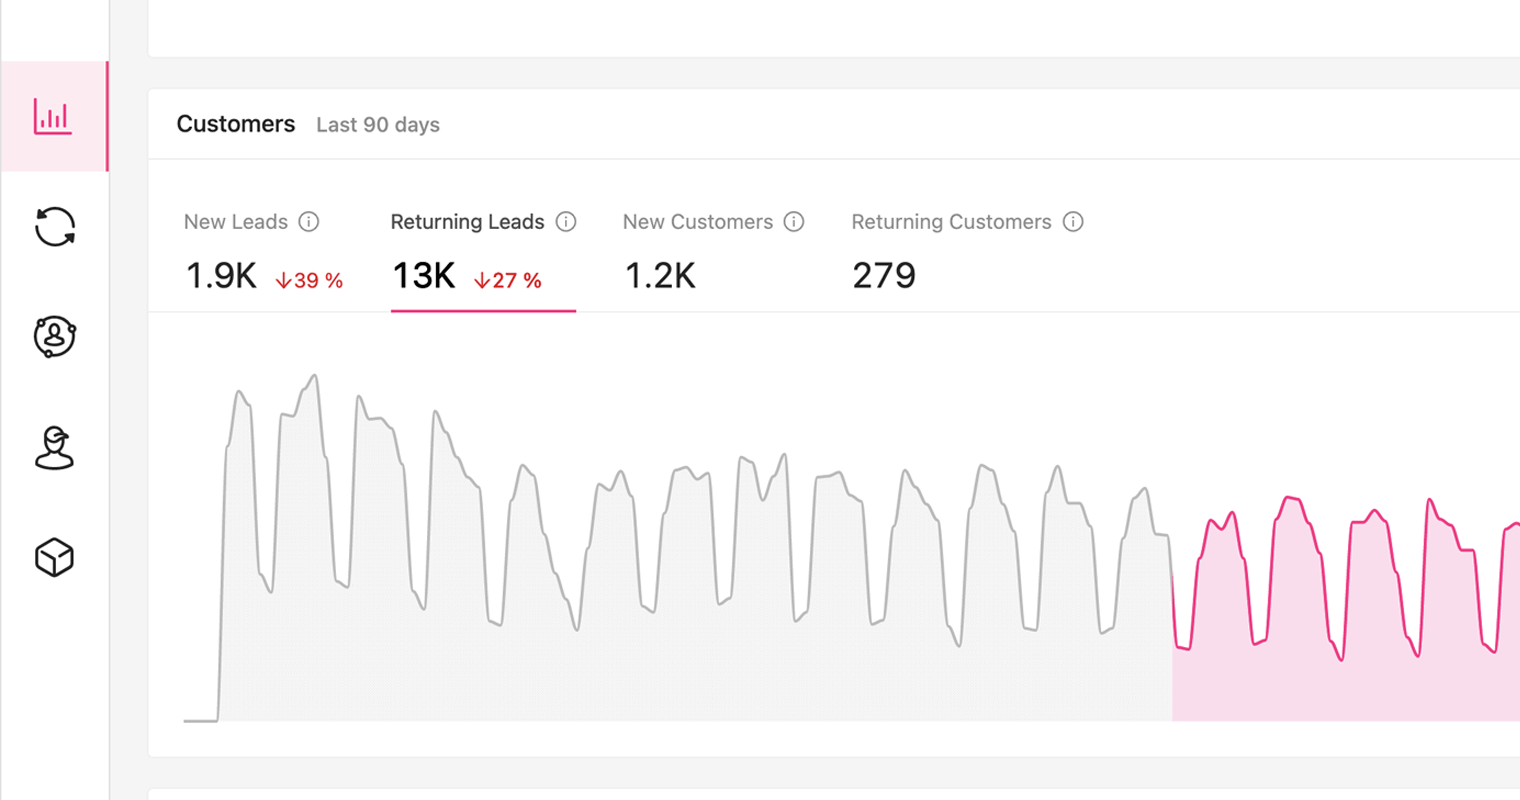
Customers
This is where you get informed about the number of your important types of leads and customers in a particular time frame. Like other metrics on the page, you can measure each with their initial value, growth rate and charts:
- New leads: Shows the total number of all new registered leads.
- Returning leads: Shows the total number of all leads who have visited your website before and come back again in the current period of time.
- New customers: The total number of users who made a purchase.
- Returning customers: The total number of customers who have made a purchase before and have returned for another purchase in the given period of time.
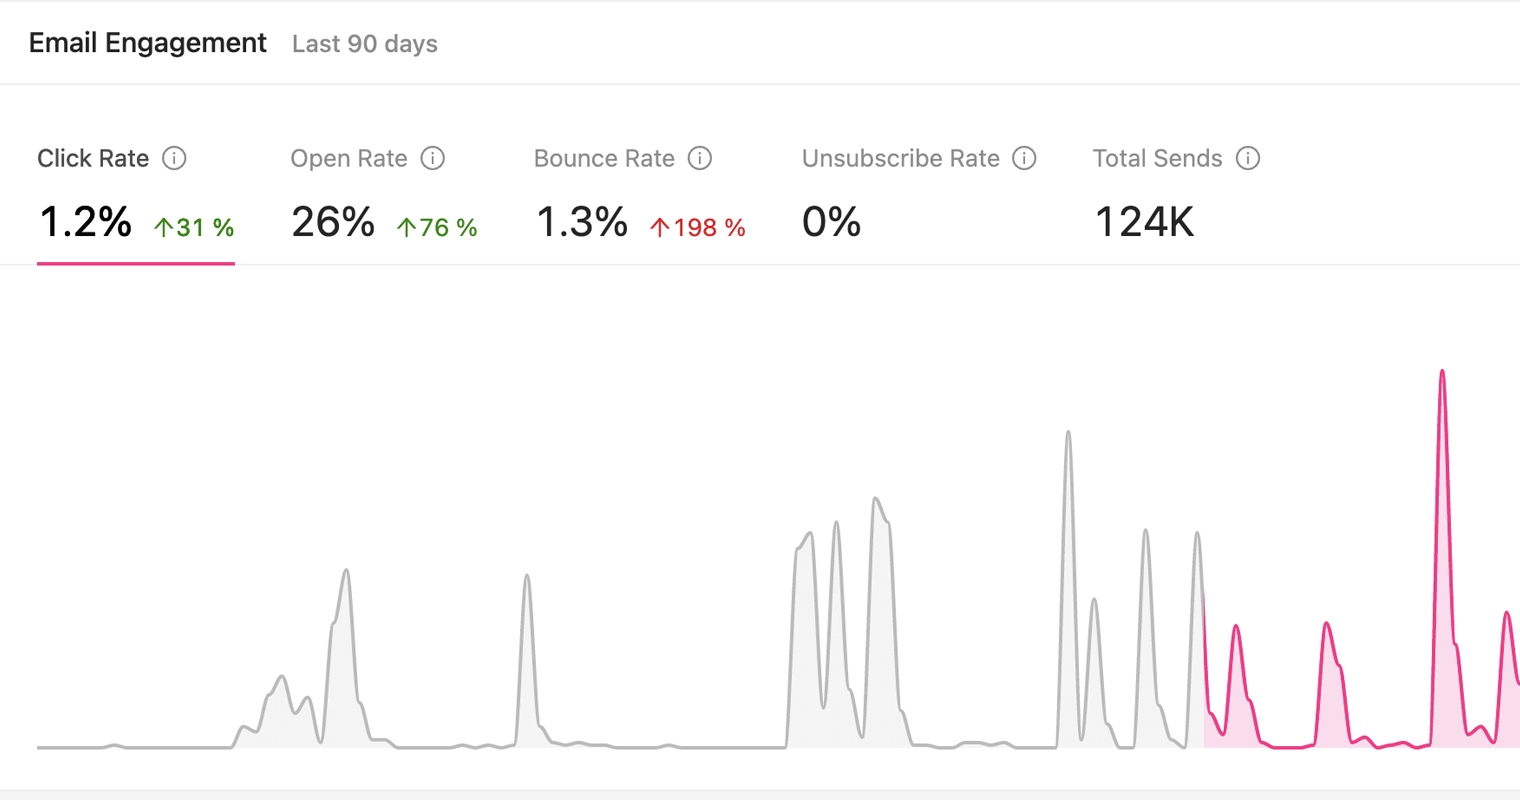
Email Engagement
This last section measures your email campaigns’ engagement with 5 unique metrics in your desired time frame. You can always measure the performance you achieve for your email marketing efforts here and get inspired to improve your future email marketing campaigns. Let’s take a look at these metrics:
- Click rate: The percentage of Growmatik emails delivered in a certain time frame that have had their included link clicked on by the recipient.
- Open rate: The percentage of Growmatik emails delivered in a certain time frame that have been opened by the recipient.
- Bounce rate: The percentage of sent emails that have bounced in a certain time frame.
- Unsubscribe rate: The percentage of users that have unsubscribed from your email list in a certain time frame.
- Total sends: is the total number of emails you sent via Growmatik.
How to change the date range in Growmatik analytics
The importance of marketing analytics becomes more tangible when you track metrics in different time frames and compare the data to unveil probable breakthrough points. Growmatik analytics provides a time selector option where you can change your date range and inspect analytics in a desired time frame. All you need to do is choose one of the following options from the provided drop-down menu placed on the right top of the analytics page:
- Today
- This month
- Last week
- Last month
- Last 7 days
- Last 30 days
- Last 90 days
- All time
How to get a detailed report of any automation rule
On the Growmatik analytics page you can only access a general overview of your metrics. If you need a detailed report related to a specific automation rule, you have to check its analytics from the automation page.
On the automations page, you can see all the running rules for different user types including guests, leads and customers. To see your analytics for each rule, select the three-dotted button at the right upper corner of a rule card and choose the Edit Rule option. A modal will open that has an Automation Report section. Here you find different metrics based on the rule type. For example, for an email campaign rule you can see all the metrics that were explained in the Email engagement section. Similarly, for a personalization rule you can follow the impression metric.

Working with Growmatik charts
Using a chart for a given set of data makes it easier to understand analytics as it visualizes the numbers for you and then gives you a better perspective when looking through your metrics. In Growmatik you can take advantage of generated live charts for every metric you select on the Analytics page.
To consider a metric via charts, first select your desired one, then choose the time frame using the Date Range option. After that, the chart will go live in a second. You can hover your cursor over the chart area and a vertical dashed line will appear. That shows a value for a specific date. It means that the vertical axis shows the value and the horizontal is representing your chosen time frame.

Best practices for using analytics with your marketing automation
We got an overview of the Analytics page and its features. Now it’s time to get into real-life practices.
Are your email campaigns successful?
Suppose that you are running different email campaigns for your audience. How would you know if you’re headed in the right direction? Is your email marketing working or should you revise and improve your plan? As a practical use of Growmatik analytics you can find answers for such questions, using the Email Engagement section. Take a look at the following example:

These metrics show that in the last 90 days you sent 124K emails with a zero unsubscribe rate as a result. That’s a very good sign that shows you are not spamming anyone or making your users get tired of receiving annoying emails.
This study indicates that usually industries should have an average Email Open Rate between 15%-25% whereas the average click rate should be about 2.5%. Based on this fact, in this example, the Open Rate is higher than average but clicking on CTAs is below the normal range. That indicates that you are probably doing well in email marketing but here there’s an opportunity to increase the Click Rate. That gives the marketing team an idea to work more on CTA and try different methods to get a better result.
How should you improve your Email Click Rate?
To discover a suitable solution, it’s better to run new email campaigns with different Call-To-Action ideas and track their effect individually in the Automation Report section. Try new ways and wait for the results. If your effort works, it’s time to scale it to all your email marketing. If not, then try other ways until you find the answer! To test and check every effort you should track your results for every email rule you set, just like in this image:

How to modify your page views using Growmatik analytics
By tracking Growmatik analytics charts that are provided in the Website Engagement section you can find probable trends or discover your page view patterns. For example, you can look for the reasons among your marketing activities when you see a sudden rise or fall on your charts. That gives you an idea of what caused your page view to change significantly. The following image shows a falling point on Aug 20 with only 506 page views. You can check if that occured because of a server crash or if it’s just because of a special event that happened on the weekend. This is how you should take time to consider your data and find answers to your questions.

One other way to take useful action is to study the Page metric by checking the More Details option. This is where you can find your top 10 pages and continue posting your content based on their niche.

How to check website stickiness
A good criteria to learn about your website stickiness is to have an overview on the Customer section in Growmatik analytics. This section shows all data about returning leads and returning customers, both of whom are really valuable to your marketplace. If your patterns break and you start losing stickiness, you will notice it immediately. This way you can avoid incoming losses and in return provide effective campaigns to fix the issue before it’s too late.

Wrap it up
If anything, accurate analytics data has become even more important in today’s marketing landscape. No one can deny the importance of marketing analytics and that’s because it’s the only tool that allows businesses to compare the impact of their marketing actions with their goals and overall vision. First, analytics allows you to better understand marketing trends and customer behavior, and second, they give you a framework by which you can monitor and evaluate the effectiveness of your marketing performance. Ultimately, data-driven decision making enables you to focus on what works, which means maximizing ROI and minimizing budget wastage.